

I. Introduction to Dynamic Non-Events
Understanding dynamic non-events is vital to sustaining high performance in safety, quality, and risk management – it ensures that the unseen, preventive work gets recognized and supported.
Welcome to The Engine Room – an additional asset for Blundercheck subscribers. Here you’ll get access to AI-generated, hand-edited briefs on core concepts in safety, technology, organization, policymaking, chess, and more. Just as open-source chess engines like Stockfish have aided, not replaced, ambitious chess players, LLMs can quickly improve your analytical game.

Post Methodology: @gpt5-5/fast -> @gpt-5/thinking/deepresearch: Prepare a prompt for Deep Research: a brief on dynamic non-events. It should explain what they are, provide examples, and illustrate how they're used conceptually. Contents: Definition, Origins, Case I: Aviation, Case 2: Vaccination Programs, How to Use the Concept, Limitations & Common Misuses, Five Key Takeaways, Sources.
Definition of “Dynamic Non-Events”
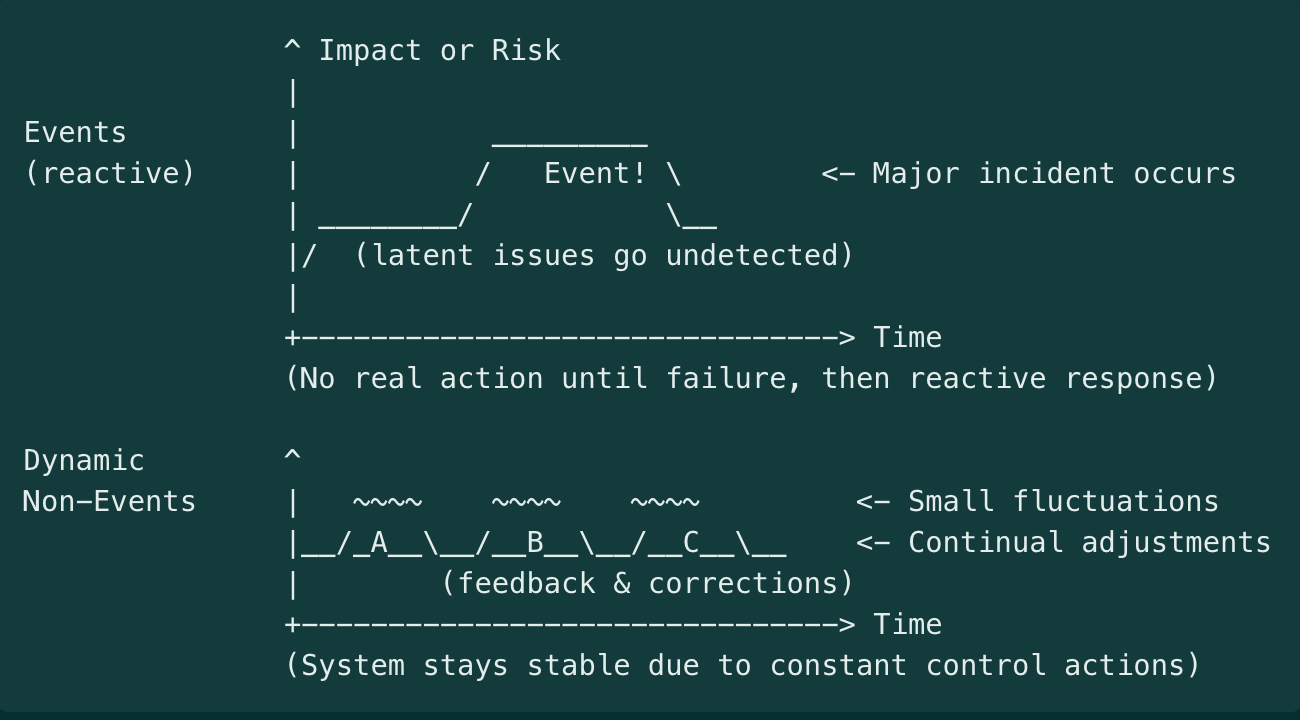
In safety and reliability contexts, a dynamic non-event refers to a desirable outcome where “nothing bad happens,” not by mere luck or static conditions, but through continuous, active efforts. In other words, safety or reliability is “a stable outcome produced by constant adjustments”. The situation appears normal and uneventful (a “non-event”), yet this stability is dynamic because people and systems are constantly detecting near misses and small changes, correcting course, and adapting to keep it that way.
The paradox is that when safety is achieved, nothing noticeable occurs – no accidents, no crises – making success almost invisible even though it’s the result of ongoing vigilance and intervention. For example, a day with no airplane crashes or no hospital errors is not simply fate; it is an actively created non-event, maintained by pilots following protocols, engineers performing maintenance, staff double-checking checklists, etc.
If those “dynamic inputs” stopped, the non-event (continued safety) would quickly break down. Thus, a dynamic non-event captures the idea that behind every quiet outcome where “nothing happened,” there is an often-unseen continuum of adjustments, monitoring, and responses keeping it that way.
Why it matters: For decision-makers, understanding dynamic non-events is vital to sustaining high performance in safety and risk management – it ensures that the unseen, preventive work gets recognized and supported, so that “nothing bad happens” continues to happen by design, not by accident.
Origins and Attribution
The concept comes from high-reliability and safety science literature. Karl E. Weick introduced the perspective in a 1987 article, where he described reliability (and by extension safety) as “a dynamic non-event”. He noted that reliable outcomes are “ongoing” accomplishments – problems are kept “momentarily under control due to compensating changes” – and that reliability is “invisible” because when nothing bad happens, operators see no obvious signal to pay attention to.
“Operators see nothing and, seeing nothing, presume that nothing is happening…. This diagnosis is deceptive… because dynamic inputs create stable outcomes.”
Weick’s insight highlighted the active, not static, nature of safe operations. James Reason amplified the idea in his work on organizational accidents, emphasizing that uneventful safety outcomes are maintained by constant change rather than sheer repetition. The concept again echoed in high-reliability organizing (HRO) principles (Weick & Sutcliffe, 2001) and by safety experts like Erik Hollnagel.
Hollnagel noted that in the traditional view (sometimes called “Safety-I”), safety was seen as the absence of accidents – essentially a non-event – which makes it hard to observe or measure directly. He and others argued for reframing safety as something that happens (what Hollnagel terms “Safety-II”), meaning the presence of successful adaptations and defenses.
Some may phrase it differently – e.g. describing safety as “the continuous achievement of nothing bad” – but the core notion is consistent. The term also appears in fields like public health (to describe preventing outbreaks) and cybersecurity (preventing breaches), even if not always using the exact words “dynamic non-event.” These adjacent fields share the analytical challenge of crediting and managing something that is defined by the absence of bad outcomes.
Case Study I: Commercial Aviation
Modern planes are one of the safest forms of travel, and a key reason is that the industry has mastered dynamic non-event production. Even the FAA has noted that “safety is not a static destination; it is [a] relentless pursuit” requiring continuous improvement.
From 2009 through the mid-2020s, U.S. airlines went for over 15 years without a fatal crash – carrying hundreds of millions of passengers without a disaster.
Interventions and Protocols
Layers of active controls and monitoring maintained this streak. Airlines and regulators implemented systems like Traffic Collision Avoidance Systems (TCAS) on aircraft, advanced warning devices, rigorous training in crew resource management, and robust standard operating procedures for every phase of flight. Each time a minor incident or “close call” occurred – say, an altitude deviation or a runway incursion – it was reported and analyzed under programs like ASAP (Aviation Safety Action Program).
Near-misses are treated as learning opportunities, prompting adjustments to procedures or technology so that they don’t become accidents. For example, if two planes come too close, that triggers reviews and often changes in air traffic control rules or cockpit procedures.
Maintenance teams also perform constant inspections and fixes: a tiny crack in an engine turbine discovered during routine maintenance might avert an engine failure that, if undetected, could have led to a crash. All these are dynamic inputs that keep the system stable. As one aviation saying goes, “Every takeoff is optional, but every landing is mandatory” – implying that safe landings are an actively managed outcome every time.
Importantly, pilots and controllers are trained to be preoccupied with failure – they are always imagining what could go wrong next, even on a “normal” day, and adjusting accordingly (e.g. changing course to avoid weather, running extra checklists when something looks off). This mindfulness helps catch problems early, preserving the non-event of an uneventful flight.
Counterfactuals
The counterfactual here is clear: without dynamic safety efforts, the statistical expectation is that several crashes would have occurred in that 15-year window (based on historical accident rates). We have seen glimpses of the alternative: regions or eras with weaker safety regimes have suffered periodic airline accidents.
In 2023, news stories highlighted a few alarming near-collisions on runways; each was a non-event (no crash happened), but only thanks to last-second alerts or corrections. These incidents illustrate the dynamic balancing act: the system came close to an event, but the layers of defense (alert controllers, cockpit warnings, pilot reactions) kicked in to maintain safety. Leaders can imagine the counterfactual – two planes colliding – to appreciate the value of those safeguards.
Metrics
Because one cannot simply count “crashes that didn’t happen,” aviation relies on leading indicators and proxies to track safety performance. Examples include the number of serious near-miss reports, rate of TCAS collision alerts, instances of runway incursions, or safety audits findings.
One could point to metrics like “millions of flights operated” and “zero fatalities,” but internally, the focus is on measuring the precursors: how many unstable approaches were corrected, how many maintenance issues found and fixed per 1,000 flight hours, etc.
Such indicators give leaders a way to gauge the health of the safety system that produces the non-events. The key is that leadership pays attention to these subtle signals – not just the absence of crashes – to remain confident that safety is truly being maintained and not just lucky.
Case Study II: Vaccination Programs
In public health, a classic dynamic non-event is a disease outbreak that never occurs thanks to preventive measures. Consider measles in the United States. In the early 1990s, measles surged to tens of thousands of cases, prompting the creation of the Vaccines for Children program in 1994. In the two decades that followed, routine childhood immunization dramatically reduced measles and many other diseases to record lows. By the year 2000, measles was declared eliminated in the U.S. – meaning year after year went by with effectively zero domestic measles transmission. This “nothing happened” outcome (no measles epidemics, no children dying of measles) was an actively produced non-event. It required sustaining high vaccination rates continuously and responding quickly to any small flare-up.
For roughly 20 years, major outbreaks were avoided, which saved countless lives. Indeed, the CDC estimated that for U.S. children born 1994–2013, vaccinations prevented about 732,000 deaths and 322 million illnesses that would have occurred absent immunization. Each of those avoided illnesses is a non-event – a sickness that never came to be, due to the dynamic shield of community immunity.
Interventions and Protocols
The interventions here are public health strategies: widespread vaccination campaigns, surveillance, and rapid response. Health workers continuously monitor disease incidence (looking for the rare cases that do occur). When a measles case is imported by travel, for example, epidemiologists race to contain it – isolating the case, tracing contacts, and boosting immunization in the area – so that a potential outbreak fizzles out. Like an emergency brake preventing a crash.
The protocols and infrastructure include school immunization requirements, routine booster shots, stockpiles of vaccines, and public awareness efforts. Dynamic is an apt descriptor: immunity in a population isn’t permanent; new children are born (who need vaccines), vaccine effectiveness can wane, and viruses evolve.
Public health authorities must continuously adjust: every year, they review vaccination coverage rates, identify communities with lower uptake, and run outreach or mobile clinics there. They also adapt recommendations (e.g. adding new vaccines or adjusting schedules) in response to emerging evidence. For instance, when small outbreaks of measles occurred in 2008 and 2014 in pockets of low vaccination, it spurred renewed campaigns and policy tweaks (like tightening school entry requirements and combating misinformation). Additionally, there are scenario simulations – public health agencies perform “if we stopped vaccinating, what would happen?” analyses that guide funding and strategy.
Counterfactuals
The counterfactual in this case is vividly illustrated by history and modeling. When vaccination programs falter, diseases return. After years of no endemic measles, the U.S. saw a resurgence in recent years in certain communities – a preview of what would happen nationwide without the vaccine program. In 2019, over 1,200 measles cases occurred (the highest in decades) mainly because some localities had low immunization rates.
This demonstrates the alternative scenario: if those dynamic efforts (ensuring high coverage) are not sustained, the “nothing happens” turns into something very bad (a widespread outbreak).
On a larger scale, one can look at pre-vaccine eras: annually, measles used to infect millions and kill over 2 million globally. The Vaccines for Children program and global vaccination efforts prevented that outcome; the CDC’s models of 1994–2013 show hundreds of millions of illnesses averted. Another counterfactual analysis: the polio eradication initiative has kept wild polio at bay in all but a couple of countries – the non-event being children not paralyzed by polio. In countries where conflict halted vaccination, polio re-emerged, illustrating what happens when the dynamic effort stops.
These comparisons underscore the value of the unseen work: without immunization campaigns, deadly epidemics would be regular events. Policymakers often use such models (“lives saved” or “cases avoided”) to visualize the invisible success and justify ongoing investment.
Metrics
Public health leaders track a mix of process and outcome indicators to ensure they’re achieving dynamic non-events. A primary metric is vaccination coverage rate (the percentage of the population immunized) – this is a leading indicator for outbreak risk. For instance, maintaining ≥95% measles vaccine coverage is known to prevent sustained outbreaks (due to herd immunity thresholds). If that metric dips in any community, it’s a warning sign even if no outbreak has occurred yet.
Another important metric is the number of “near-miss” outbreaks detected and contained. For example, health departments track how many cases of a disease were imported and how many secondary cases arose; if each import only leads to, say, one or zero further cases, that indicates the system is holding. Conversely, if one import leads to dozens of cases, that signals a gap. They may also use surveillance metrics like environmental detection of poliovirus (in sewage samples) – finding the virus before any paralysis cases occur is akin to an early warning that prompts action. Leaders can also look at modelled estimates of cases prevented as a high-level indicator of program impact (as the CDC did with 732,000 deaths averted ).
Additionally, exercise drills and audits serve as indicators: e.g. how quickly can the team respond to a simulated outbreak, or what percentage of outbreak investigations meet timeliness goals – these gauge the readiness that underpins the non-events. Communication metrics are considered too (e.g. public trust levels or misinformation prevalence), since those affect vaccination uptake. In summary, instead of waiting to count bodies in an epidemic, public health uses proactive metrics to ensure the epidemic never materializes. A practical proxy on an executive’s dashboard might be a “risk index” combining coverage, surveillance findings, and response times, which together predict the likelihood of maintaining the non-event (no outbreaks).
Using the Concept of Dynamic Non-Events
The dynamic non-event perspective is useful for any domain where success is defined by preventing bad outcomes rather than reacting to them. Leaders in operations, safety, security, quality, or policy should adopt this mental model when evaluating performance in high-risk or mission-critical activities.
If your organization’s goal is “nothing bad happens” – e.g. zero accidents, zero outages, zero security breaches – then you are by definition managing dynamic non-events. This lens is especially vital in stable high-hazard operations (chemical plants, nuclear power, aviation, healthcare, etc.), in risk management and compliance (where you strive to ensure no violations or losses), and in preventive public policies (public health, disaster mitigation, financial system stability). It shifts focus to how stability is produced.
Practically, you would use this concept in scenarios like: making a business case for safety investments (“we need to fund X to prevent incidents that haven’t happened yet”), conducting after-action reviews of near-misses (treating them with the same gravity as accidents), or designing metrics and incentives for preventive work. It’s also a powerful communication tool when you need to reinforce vigilance (“we haven’t had a data breach – but that’s because our team is catching dozens of attempts each day”). In summary, whenever success metrics are void of incidents, that is a cue to examine the dynamic inputs keeping it that way.
Reporting and Budgeting
One challenge with dynamic non-events is that traditional reporting can make it look like “nothing is happening,” which can lead to complacency or budget cuts. Managers can counter this by reporting leading indicators and proactive accomplishments. For instance, instead of just reporting “0 incidents this quarter,” a safety report might include, “500 hazard reports submitted and 480 mitigated; 3 emergency drills conducted; safety audit compliance at 98%.” This paints a picture of activity behind the zero incidents.
Another strategy is to use counterfactual storytelling: e.g. “Because we replaced those aging valves, we likely avoided a major spill – here’s how that scenario could have unfolded.” Some organizations actually calculate a return on prevention by estimating costs of incidents averted. While imprecise, it helps justify budgets.
One pithy saying is that “safety is a dynamic non-event, so it doesn’t show up as a line item in a budget.” In practice this means you may have to get creative: e.g. bundle safety improvements with efficiency improvements, or use regulatory requirements (which mandate certain preventive measures) to justify expenditure. It also helps to present leading metrics in financial terms where possible (e.g. “near-miss reports are up 30%, which is good – it indicates a reporting culture that can preempt costly accidents”).
Essentially, you reframe “nothing happened” from a passive state to an achievement that requires resources. Some organizations include in their annual report a section on “incidents avoided” or “safety interventions,” listing examples of problems caught in time – this can lend tangible reality to non-events for stakeholders.
Leading Indicators and Near-Miss Logs
A core principle of using the dynamic non-event concept is to measure and monitor the process, not just the outcome. Leading indicators are metrics that precede and predict the desired outcome (continued safety). These include things like number of safety audits performed, percentage of employees up-to-date on training, equipment inspection compliance rates, count of security penetration tests conducted, etc.
Near-miss and incident logs can be* gold mines for leading information. A near-miss (or “close call”) is essentially an event that almost happened. Tracking near-misses rigorously allows an organization to learn and adjust without suffering the full damage. For example, if airline pilots report an uptick in unstable approaches (where a go-around was needed), that’s a sign something in the system is degrading – perhaps fatigue issues or training gaps – and it gives a chance to fix it before an accident. In a hospital, if a nurse reports “almost gave the wrong medication but caught it,” that goes into a database; if similar reports pile up, management knows a latent error (maybe labeling or packaging issues) needs addressing.
High-reliability organizations cultivate a “reporting culture”: they encourage employees to speak up about even the smallest anomalies. This provides data for continuous improvement. It’s critical to analyze near-misses with the same seriousness as accidents: perform root cause analysis, implement corrective actions, and follow up. Some organizations even assign risk ratings to near-misses to prioritize responses (e.g. a near-miss that could have been catastrophic if not caught is treated with high priority).
*If you’re not collecting lots of data on incidents, but could be – that’s a higher priority than, and sets the groundwork for, leading indicators
Limitations and Common Misuses
No concept is without its pitfalls. While dynamic non-events are a powerful way to think about safety, leaders must be mindful of several limitations and potential misuses:
Attribution Dilemma: It’s inherently difficult to prove a negative. If nothing bad happened, how do we know which actions or factors to credit – or whether we simply got lucky? Misattribution can also occur: an organization might falsely assume safety is due to their excellent processes, when in reality it was because operations were light or some external factor – leading to complacency. Counterfactual analysis and simulation can help but, decision-makers should acknowledge uncertainty in claims like “we prevented X.”
Invisible Success and Survivorship Bias: Dynamic non-events suffer from what some call the “silent evidence” problem – successes are largely invisible, while failures are very visible. This can distort learning. Conversely, survivorship bias can lure teams into a false sense of security: “We’ve never had a big incident, so our way must be safe.” That mindset forgets the near-misses or the times when luck played a role.
Complacency and Budget Cuts: Success can breed complacency – a major risk of dynamic non-event management. When no crashes or breaches occur for a long time, stakeholders may start to question the value of continued investment: “Do we really need this much spend on safety or prevention? Nothing bad ever happens here.” This is sometimes called the prevention paradox: when prevention works, people wonder if it was necessary at all. Complacency is the enemy of dynamic safety – as one safety maxim says, “Nothing fails like success.”
Overfitting Metrics and False Indicators: When trying to measure non-events, there is a temptation to use proxy metrics that may not truly reflect safety. For instance, an organization might start measuring “number of safety training hours” or “safety meetings held” under the assumption that more meetings = more safety. The dynamic non-event concept requires nuanced metrics and understanding. You want indicators, but you must ensure they remain meaningful and not easily gamed.
Miscommunication of “No Problems”: A subtle misuse is the way non-event success is communicated. Claiming “we have zero incidents because we’re perfect” can breed overconfidence or skepticism. It’s more honest (and effective) to say “zero incidents – and here’s the hard work and continual concern that got us there”. Additionally, organizations sometimes err by not communicating about safety at all when things are fine, leading the public or higher management to assume it’s a non-issue – until a crisis hits and they wonder why more wasn’t being done. Proactive communication about dynamic non-events, as discussed earlier, is important: it educates stakeholders that safety isn’t automatic.
Five Key Takeaways
Safety is active, not passive: Reliability and safety don’t “just happen” – they are ongoing achievements. Even when nothing bad occurs, it’s because people and systems are continually adjusting and responding to keep risks at bay. Think of safety as the result of constant work, not as the absence of work.
Invisible does not mean effortless: Dynamic non-events are inherently hard to notice. When operations run smoothly, it’s easy to overlook the myriad small interventions and decisions that prevented an accident. Leaders must therefore make the invisible visible by tracking proactive measures (inspections, near-misses, maintenance, training) and by telling the story of what didn’t happen and why.
Measure and reward the process: Traditional metrics (accident counts, downtime) only tell you about failures, not about ongoing safety. To manage what doesn’t happen, use leading indicators (hazards identified, near-misses reported, safety tasks completed) as proxies for safety health. Reward teams for reporting issues and solving them – treat a near-miss as equivalent to a hit in terms of learning value.
Beware of complacency: A spotless record can be dangerous if it breeds overconfidence. Always assume that “we are safe for now” and remain vigilant. History shows many disasters (Challenger, Deepwater Horizon, etc.) were preceded by periods of apparent normalcy where warning signs were downplayed. Don’t let “no news” become an excuse for inaction or budget cuts – instead, use no news as proof that your preventive efforts are working, and double down on them.
Communicate the value of non-events: Successful prevention can be a victim of its own success. It’s critical to find ways to communicate value to stakeholders – through data, scenarios, or analogies – so that everyone understands that stability is being actively earned, not just granted. For decision-makers, the dynamic non-event mindset means investing in defenses you hope will appear “over-cautious” in hindsight (because if they fully succeed, nothing bad happens). That foresight is far cheaper and safer than reacting after an avoidable catastrophe.
Sources
Weick, Karl E. (1987). “Organizational Culture as a Source of High Reliability.” California Management Review 29(2)
Reason, James (1997). Managing the Risks of Organizational Accidents.
Hollnagel, Erik (2014). Safety-I and Safety-II: The Past and Future of Safety Management.
Federal Aviation Administration (2023). “Ending Serious Close Calls” (FAA Safety Call to Action).
Centers for Disease Control and Prevention – CDC (2014). “20-year US immunization program spares millions of children from diseases” (Press Release).
St. Pierre, Michael (2013). “Safe patient care – safety culture and risk management in otorhinolaryngology.” GMS Current Topics in Otorhinolaryngology – Head and Neck Surgery 12, Doc05.
Vaughan, Diane (1996). The Challenger Launch Decision: Risky Technology, Culture, and Deviance at NASA. University of Chicago Press.
Rasmussen, Jens (1997). “Risk management in a dynamic society: a modeling problem.” Safety Science 27(2/3): 183–213.